Through November 2024 With Forecasts Through November 2025
Home prices nationwide, including distressed sales, increased year over year by 3.4% in November 2024 compared with November 2023. On a month-over-month basis, home prices increased by 0.06% in November 2024 compared with October 2024 (revisions with public records data are standard, and to ensure accuracy, CoreLogic incorporates the newly released public data to provide updated results).
Forecast Prices Nationally
The CoreLogic HPI Forecast indicates that home prices will drop by -0.2% from November 2024 to December 2024 and increase by 3.8% on a year-over-year basis from November 2024 to November 2025.
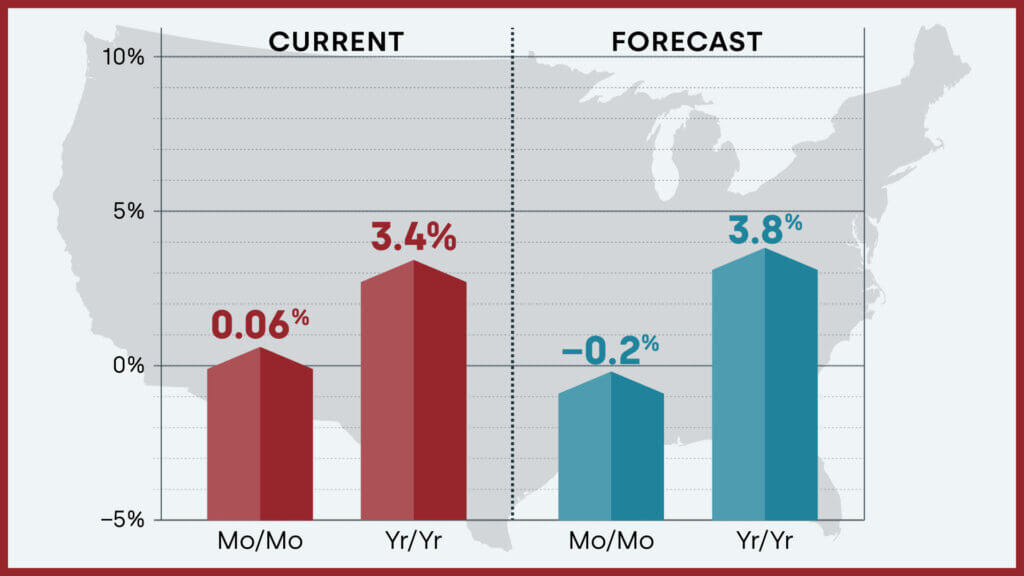
Chart 1: Current month-over-month and year-over year U.S. home price growth and projections through November 2025
Northeast Remained Hot Even as Homebuying Season Cooled Off for 2024
While the Northeast dominated November U.S. home price growth trends, the three core based statistical areas (CBSAs) with the most significant growth were primarily in Appalachia. The Wheeling, WV and Ohio area; Johnstown, PA; and the Huntington-Ashland metropolitan area that spans seven counties in Kentucky, Ohio and West Virginia all saw year-over-year price growth jumps, increasing by 20%, 16%, and 14.8%, respectively. Unsurprisingly, this substantial CBSA-level growth spurred prices in West Virginia to reach new records in November 2024.
Looking farther west in the U.S., states continue to lag their previous peaks, Wyoming, Idaho, Washington and Hawaii saw prices remain the furthest from their peaks in November, with declines ranging from -3.5% to –2%.
Despite pockets of decline, national prices are continuing to trend upward, even in the off-season. The November median sales price for all single-family homes in the U.S. was $395,000, up $10,000 from the previous month. Come spring, it is likely that the national housing market will be reinvigorated and push prices even higher.
“Heading into the end of the year, home prices remained relatively flat though showing some marginal improvement from the weakness seen moving into the fall and following the cooling of homebuyer demand amid the summer mortgage rate surge. Nevertheless, the cooling home price growth trend is expected to continue well into 2025, partly due to the base effect and comparison with strong early 2023 price appreciation and partly due to higher mortgage rates coming into this year and the expectations of higher rates over the course of 2025. Regionally, variations persist, as some affordable areas – including smaller metros in the Midwest — remain in high demand and continue to see upward home price pressures.”
Dr. Selma Hepp
– Chief Economist for CoreLogic
HPI National and State Maps – November 2024
Nationally, home prices increased by 3.4% year over year in November. No state posted an annual home price decline. The states with the highest increases year over year were New Jersey (up by 7.8%) and Rhode Island (up by 7.3%).
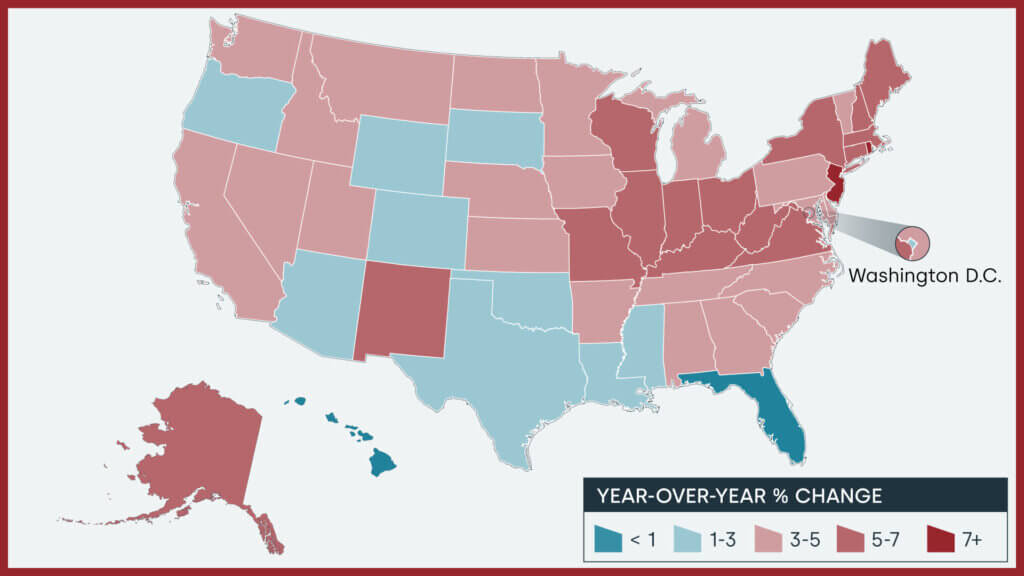 Chart 2: Year-over-year home price changes by state, November 2024
HPI Top 10 Metros Change
The CoreLogic HPI provides measures for multiple market segments, referred to as tiers, based on property type, price, time between sales, loan type (conforming vs. non-conforming) and distressed sales. Broad national coverage is available from the national level down to ZIP Code, including non-disclosure states. Below is a look at home price changes in 10 select large U.S. metros in November, with Chicago posting the highest gain at 5.8% year over year.
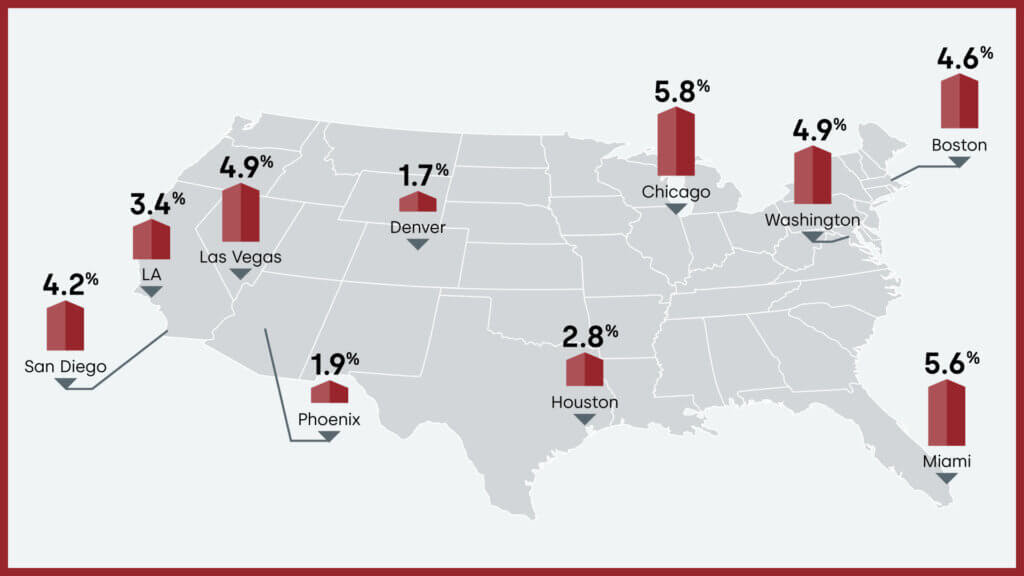
Chart 3: Year-over-year home price changes by select metro areas, November 2024
Markets to Watch: Top Markets at Risk of Home Price Decline
The CoreLogic Market Risk Indicator (MRI), a monthly update of the overall health of housing markets across the country, predicts that Provo-Orem, UT (70%-plus probability) is at a very high risk of a decline in home prices over the next 12 months. Albuquerque, NM; Tucson, AZ; Phoenix-Mesa-Scottsdale, AZ; and Punta Gorda, FL; (70%-plus probability) are also at very high risk of declines in home prices over the next 12 months.
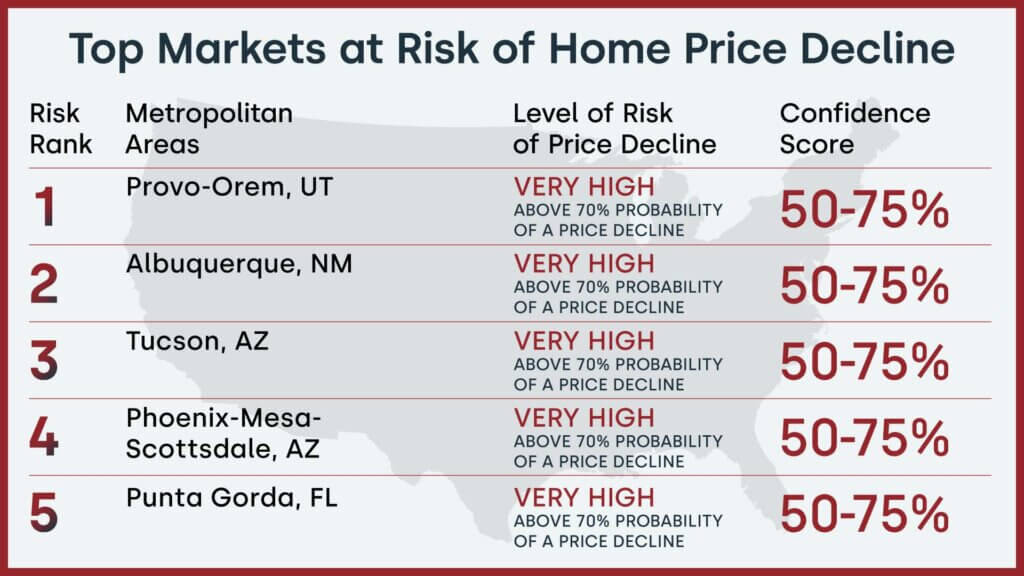
Chart 4: Top five U.S. markets at risk of annual price declines, November 2024Summary
CoreLogic HPI features deep, broad coverage, including non-disclosure state data. The index is built from industry-leading real-estate public record, servicing, and securities databases—including more than 40 years of repeat-sales transaction data—and all undergo strict pre-boarding assessment and normalization processes.
CoreLogic HPI and HPI Forecasts both provide multi-tier market evaluations based on price, time between sales, property type, loan type (conforming vs. non-conforming) and distressed sales, helping clients hone in on price movements in specific market segments.
Updated monthly, the index is the fastest home-price valuation information in the industry—complete home-price index datasets five weeks after month’s end. The Index is completely refreshed each month—all pricing history from 1976 to the current month—to provide the most up-to-date, accurate indication of home-price movements available.